
Sometimes the only thing you need is to see how is your bandwidth usage, or even another metric, without having to install complex management systems like Zabbix. Or sometimes the only thing you want is to take a look over what changes in the server load when you run that simple batch process you are working on.
With those situations in mind is that the QuickMon were created, a simple portable executable to help in basic troubleshooting tasks. But what QuickMon can do for you?
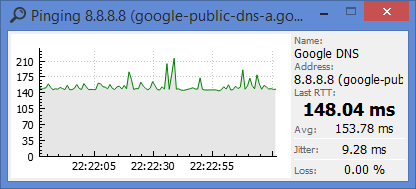
Ping
A simple ping tool that transforms all that numbers in something more intuitive.
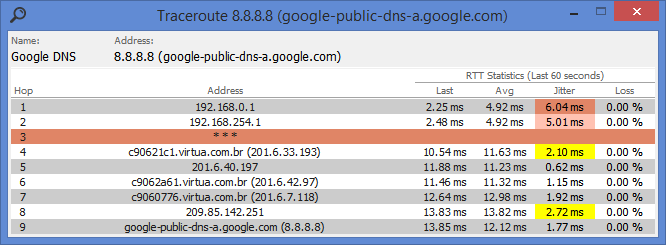
Traceroute
The tracetool, in addition to tracing network routes, keeps pinging the network hops to update the response time, jitter and the packet losses for each of them.
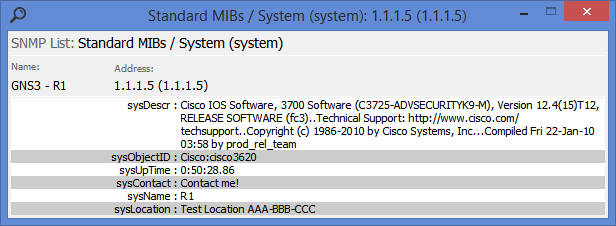
SNMP Tools
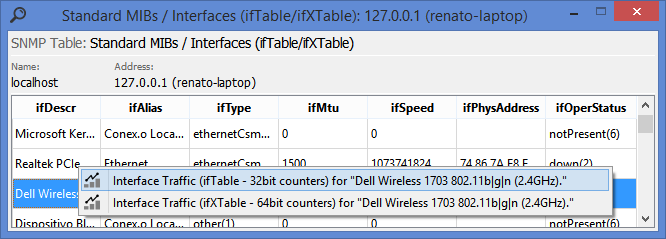
Finally we are going to talk about the best feature in this application, the SNMP tools. Its internally divided in three types of tools, the lists, tables and graphs. Thanks to an proprietary template design using Json format, new items can be easily added to SNMP Tools list. Take a look at some examples below:
Basic system information list:
Standard interface table:
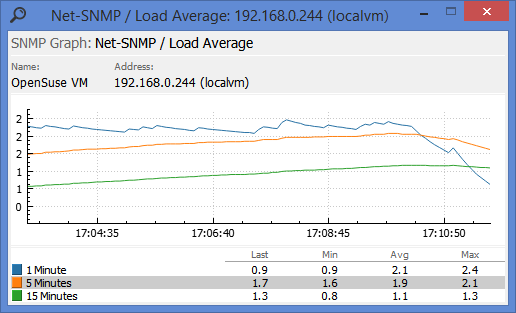
Linux load average graph:
Please fell invited to try to add your own SNMP template based on any Mib you work with. There are some instructions about how to proceed in Adding user's template.
You can also look for more information, post bugs, send suggestions or even see the source code in QuickMon's GitHub page.
Whoa, nice. Thanks for explanation. :)
ReplyDeleteI find it very useful that this tool provides a simple way to monitor system metrics.
ReplyDelete